Monday, June 9, 2008

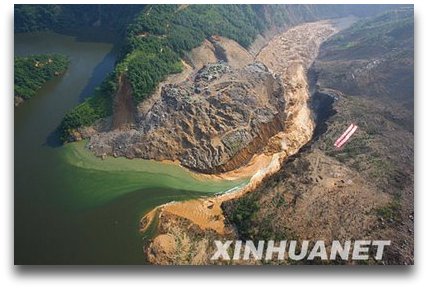
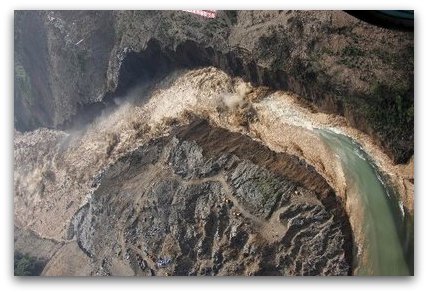
Landslide Dam Failure in China


The significance of these photos to the average Yeehow is quite clear. The principal landslide dam following the recent major earthquake in China has failed. These photos show the breach and the incredibly cool draw-down tongue. For some cogent discussion about this event, check out the blog of Dr. David Petley at which I found the bottom two images and a lot of commentary: http://daveslandslideblog.blogspot.com/

Tuesday, June 3, 2008

Damming Ruminations by Brother Spud

Hi Folks,
Here are the figures from my thesis that relate to the last post I made on friday night. I hope they help you visualize some of what I described.

-Spud


Figure 2. Exposure of the Saddle Butte lava near Read-it-and-Weep rapid (river kilometer 34.25). Exposure shows foreset beds of hyaloclastite and lava pillows, the passage zone, and subaerial lava. The foreset beds of pillow lavas and hyaloclastite dip down to the right, indicating that the lava advanced from left to right into a body of standing water. Much of the hyaloclastite has altered to orange-colored palagonite. The passage zone marks the elevation of the water surface. Above the passage zone, subaerial lava was emplaced. Exposure is ~60 m thick.


Figure 15. Aerial photograph of river kilometers 37.5–39.5 showing presumed initial location of West Crater lava dam. The Owyhee River flows to the north in this image. The red dashed ellipse marks the location of a possible spillway in the West Crater dam and/or the initial point of breaching. The asterisk denotes the location of the sediment lens depicted in Figure 16. Ryegrass Creek defines the western edge of the Saddle Butte lava flow. The West Crater lava flow entered the Owyhee Canyon by flowing down the Bogus Creek canyon. Enough lava was supplied to the Owyhee Canyon that the dam was able to grow upstream towards Ryegrass Hot Spring.


Figure 16. Photograph of outcrop relations at river kilometer 39.25. The Saddle Butte lava appears to underlie the sediment lens in the center of the photograph. The head of the West Crater lava dam overlies the sediment lens and the Saddle Butte lava. Foreset beds of pillow lavas and hyaloclastite dip down to the right in this image. Several different passage zones (indicated by PZ) indicate the lake level rose during construction of the dam. The location of the paleovalley wall discussed in Figure 15 is indicated by a dashed ellipse. The lens of sediment interpreted to be paleo-Ryegrass Creek is visible in the center of the photograph.


Friday, May 30, 2008

Speculations and Declarations from the Spud

Oooohh Boy, Here are some ramblings for you to chew on, some of which I have been chewing on for some time (years). Dr. Jerque’s previous comments are in italics. Sorry to post a dry reply without any figures--I am having trouble pulling them into the blog--will try on Sunday. Figures 2, 15, and 16 are pretty relevant to the discussion.

The upper West Crater lava in the presumed abutment on river right does not have lava-delta deposits (wtf?). In the field, it looks like a dry flow. Why would water have not backed up in this area during the blockage? The contact of young WC on Old WC marks the perimeter of the 3400 ft lake. I suppose this part could have been dry initially as the flow continued in a generally downstream direction....

Yes, the youngest WC (above the 3400 ft contour) does not appear to have any evidence of lava-water interaction. But, the uppermost flow units immediately below 3380 ft surface do transition quickly (within a few meters) into a lava pillow delta via a passage zone (see Figure 2 in my thesis). I can think of at least two options for why the lava above the 3400 ft contour doesn’t have any pillows: 1) Lava was entering the river canyon at a much faster rate than the river discharge (and the rate of lake rise) such that the lava dam growth outpaced the rise of the reservoir; 2) the level of the reservoir stabilized at ~3370 ft (perhaps because a stable spillway developed adjacent to Pruitt’s Castle or because the dam was porous). In either case, if the full discharge of the river could seep through or sneak around the dam, the crest of the dam could grow uninhibited and not be within the reach of the water.


Option 1 is complicated by the fact that we know that the rate of dam construction and lake level rise was semi-episodic because of the presence of multiple passage zones (and accompanying subaerial lava) preserved within the dam.

Option 2 could work because portions of the dam could be porous as observed by Crow et al. (2008), a spillway could have been eroded into the ridge of Tertiary that makes Pruitt’s Castle (near the white star in figure 15 of thesis) contemporaneously with dam construction and lake filling, or some combination of both. In regards to the porosity of the dam, our friendly neighborhood p-mag expert and I discussed this during the recent trip. I had originally conceptualized that the pillow lava deltas would be rather porous but our p-mag expert pointed out that they are likely rather well-consolidated for several reasons. For example, as the deltas form, they are sort of self-packing—a variety of clast sizes are settling and snuggling together as they tumble down and more material is added from above. In addition, some large clasts (pillows) could still be somewhat plastic and deform to fit the space provided them, almost welding together. Depending on the dissolved gases in the lava, its temperature, and the ambient pressure at the locus of emplacement (and maybe some other parameters), the crust of the growing lobes and pillows of lava fractures into tiny glassy quenched bits (hyaloclastite) that serve to fill any interstices in the delta. This hyaloclastite can dominate the delta by volume, leaving the delta matrix supported, and when the hyaloclastite devitrifies, lots of clay minerals are produced further reducing the hydraulic conductivity of the dam (an turning some portions of the dam tan-orange in color—see photo). In contrast, Crow et al. (2008) identified actual cinders in the presumed abutments of some of their lava dams and they even called some dams “sieves” rather than dams. Depending on how these pyroclastics in the Grand Canyon were emplaced, they could provide the necessary porosity to accommodate the discharge and stabilize the lake height. How about that? Are there other models you can think of to explain the outcrops?

In regards to Dr. Jerque’s questions about the timing of individual incursions of lava into the river and the total lifespan of the obstruction created, I think the dams are built quickly. The vents supplying lava to the intracanyon lava flows are monogenetic and probably have a life span of months, years, or perhaps tens of years, but not hundreds of years. From my understanding of Snake River Plain volcanism and the experience of those such as our p-mag expert, these lava flows could easily erupt, flow across the uplands, and build a dam in a few months or maybe several years. During that time, individual pulses of lava (flow units, cooling units, surges, etc.) added to the obstructions created by the first lavas in a tug of war battle with the rising lakes. The multiple (and rising in elevation) passage zones at Weeping Wall and WC at tell us this. The resulting dam is so geologically instantaneous that it makes sense to me to model it mostly as a single event. The details of the passage zone elevations, relative amounts of subaerial vs subaqueous lava, and volume of hyaloclastite tell us some of the juicy details of the event but in terms of the ~2 Ma history of the river available to us to model I would consider it one event. Even in the case of the SB dam, where there are two clearly different advances into the canyon (that potentially could be separated by a lot of time) we do nto see any different in age with the p-mag. We also do not see any fluvial deposits intercalated within the dam architecture that would suggest a long time interval (1000s to 10000s of years). What do you think?


One of my thesis’ objectives was to try to add data to, and refine, lava dam emplacement and breaching models (and the associated hazards) by trying to study how the rate of lava effusion into a river interacts with the river’s discharge and channel morphology to influence the structure and stability of lava dams. This objective was often overshadowed by the larger objective of just trying to figure out what he-ack is going on out there and distinguish the lava flows from one another but I do think that there is enough data to address the matter in the paper I am putting together on the lava flows.

Cheers,

Spud

Wednesday, May 28, 2008

Lava-dammed lakes in Owyhee Canyon

Here is a thought-provoking image that I created in Global Mapper this evening (click on it to enlarge). It shows the extent of a dam with a crest elevation of 3400 feet, which is the approximate elevation of the Saddle Butte 2 and West Crater Lava Dams (right, I couldn't get the blue from extending downstream, but you get the point). I have sketched in some likely dam locations...the Saddle Butte Dam is obvious because both abutments still exist. The West Crater dam, however, is a little harder to guess. The right (east) abutment is pretty obvious, but the left (west) one is not. In both cases, as we know, Rome Valley was inundated. Duh (in hindsight)

Other points:

The upper West Crater lava in the presumed abutment on river right does not have lava-delta deposits (wtf?). In the field, it looks like a dry flow. Why would water have not backed up in this area during the blockage? The contact of young WC on Old WC marks the perimeter of the 3400 ft lake. I suppose this part could have been dry initially as the flow continued in a generally downstream direction....

In the case of each dam, the damming event that is most well preserved 'immediately' post-dates an intracanyon flow from the same vent. We don't have any direct evidence that these flows dammed the river...but they certainly may have, or did they? wtf?

Is it of any interest to the modeling and general conceptualization of the processes that the lava events that clearly dammed the river were damming a river that may still have been in the process of dealing with the previous lava incursion from the same vent? (thus not so long ago, relative to the damming event).

Any thoughts? Break down and post some comments or, maybe, your own diagram....

Tuesday, May 13, 2008

First view of Geologic Map in Google Earth


Ok. So I recently learned that ESRI actually provides a kml-making tool in the toolbox. That is handy. I haven't yet figured out how to create a clean version to distribute, but this screen shot should provide some perspective on where this can go.

Wednesday, May 7, 2008

Shaded Relief Revelations

I used Globalmapper (more on that later) to quickly create this shaded relief image of the study area. Are most of the lava platforms that are so evident in this image related to lava-dams? The various volcanic structural forms in this image are really very striking. If it turns out that all or most of these features reflect late Neogene lava-water interaction, this is a fairly significant landscape-forming process in this region...the distribution of these features on the landscape record the progressive incision of the Owyhee River over a very long time, no?

Sunday, May 4, 2008

Traverse Documentation via Garmin 60csx and Topofusion


Maybe my geotagged photos convinced you that using a good gps in the field serves numerous purposes. Consider how it can document your field progress...and that of your students(!) or fellow mappers. Here is a snippet of the Qbw traverse that Jim, Robin, and I made. I have one for every day and it only took 6 batteries to record the entire trip...

Friday, May 2, 2008

First Glance at Fully Geotagged Photos From Recent Trip

The embedded slideshow below includes all of the photos that I took on the trip. They are all geotagged and it is very cool to view them on the map (click 'view map'). Zoom in in terrain mode and have at it. Be sure to check out the areas most far flung from the river...or anywhere that you didn't go. I will eventually trim this collection down and add some captions. Sorry, very few people pictures.

Rare Sighting of Yeehow in Spring Plumage

It is not every day that you have a chance to see a Yeehow in this condition of 'dress'. I have taken a step away from the scientific focus of the blog to share this spectacularly rare image:

Thursday, April 10, 2008

Align your mind with the Owyhee...Spend some time with this slideshow.

Preparing for the upcoming trip? This will help align your mind. Most of these photos are from the rim or, at least, off the river. I certainly love river trips, but the geologic context of the study area is best appreciated from above.

The slides below can be viewed in relation to a map of where the photos were taken because they are geotagged. Just click on a slide and your browser should open up the online photo album. Click on view album map to see where the photos were taken. Zoom in and notice that Google Maps now includes contours in terrain view. That is cool. Click on view in Google Earth and learn a little more about where the photos were taken.

Friday, March 28, 2008

Caving in on the Owyhee...A public service announcment

This conveniently dated photo of Lisa logging strat pits in the dark is telling for several reasons. Firstly, it notes the date of the first Owyhee adventure...back when we were focused on the boring floods of the Holocene; secondly, it represents the last year that I used a conventional camera. Very recently, I noted that I was completely ignoring my geologic slide collection. So, instead of picking some choice slides and scanning them myself, I sent 996 slides to a company in Arizona that scanned them all at 2000 dpi, burned them as tifs and jpgs to DVDs, archived them, and mailed them back in less than 3 weeks for only $550. It would have taken me weeks of my own time to do the same. Check it out: www.digmypics.com.

Accept the fact that you also need to cave in and send your slides to a similar place so that you can actually view them, organize them, remember them, etc. Your slides are just getting older and older. One day they will mean very little to you. Digitize them now. You will be very happy with the results.
Posted by Picasa

Thursday, March 27, 2008

Owyhee Research at GSA in Vegas

Cordilleran Section (104th Annual) and Rocky Mountain Section (60th Annual) Joint Meeting (19–21 March 2008)
Paper No. 1-9
Presentation Time: 11:00 AM-11:20 AM

QUATERNARY BASALTIC VOLCANISM ALONG THE NORTHWESTERN MARGIN OF THE OWYHEE PLATEAU, SE OREGON

SHORT, Emily J., JASTRAB, Jamie M., and HART, William K., Geology, Miami University, 114 Shideler Hall, Oxford, OH 45056, shorte@muohio.edu

The Owyhee Plateau tectonomagmatic province is located in the Oregon-Idaho-Nevada border region and preserves evidence of complex magmatic processes and mantle reservoir interactions over the past 17 Ma. Quaternary basaltic volcanism is concentrated along the northern and northwestern margins of the Plateau in a number of discrete to overlapping volcanic fields characterized by monogenetic cones and small shields. The focus of this investigation is three young basalt volcano fields, the Saddle Butte field (SdB), Jackie's Butte field (JB), and Scott's Butte field (ScB), that lie near the suggested physical northwestern edge of the Owyhee Plateau. In contrast to the multiple monogenetic shield vents of the SdB and the JB, the ScB is dominated by a single vent complex (Scott's Butte) that preserves evidence of early hydrovolcanic activity followed by emergent central and satellite vent Strombolian and Hawaiian activity. New stratigraphic observations and preexisting K-Ar data, when viewed in the context of more extensive chronologic data for the nearby Jordan Valley volcanic field (JVVF), indicate that the volcanism considered in this investigation is less than approximately 1.2 Ma, with portions of the Saddle Butte field likely less than 100 ka in age. Furthermore, stratigraphic relationships along the Owyhee River canyon document the presence of flows likely emanating from 1.9 Ma and older JVVF vents stratigraphically beneath eruptive products of the SdB. Between volcanic field and between vent major and trace element variability is observed including little fractionated, LIL and HFS element depleted olivine tholeiites (HAOT) in the SdB and JB, basalts with characteristics in common with certain Snake River olivine tholeiites (SROT) and young JVVF alkaline basalts in the JB, and basalts transitional to these varieties in the ScB. Within vent geochemical heterogeneities also are observed, only some of which may be produced via shallow fractional crystallization and/or small differences in degree of melting. The observed geochemical complexities require the presence of heterogeneous lithospheric mantle and lower crustal reservoirs beneath this region and post magma generation differentiation processes that involve mixing of heterogeneous melts and/or melts and solids derived from these reservoirs.

Cordilleran Section (104th Annual) and Rocky Mountain Section (60th Annual) Joint Meeting (19–21 March 2008)
General Information for this Meeting

Session No. 1
Igneous/Metamorphic Petrology, and Volcanology
University of Nevada-Las Vegas: Student Union 208C
8:00 AM-12:00 PM, Wednesday, 19 March 2008

Geological Society of America Abstracts with Programs, Vol. 40, No. 1, p. 34

© Copyright 2008 The Geological Society of America (GSA), all rights reserved. Permission is hereby granted to the author(s) of this abstract to reproduce and distribute it freely, for noncommercial purposes. Permission is hereby granted to any individual scientist to download a single copy of this electronic file and reproduce up to 20 paper copies for noncommercial purposes advancing science and education, including classroom use, providing all reproductions include the complete content shown here, including the author information. All other forms of reproduction and/or transmittal are prohibited without written permission from GSA Copyright Permissions.

Tuesday, March 4, 2008

Yeehoogle Earth


While procrastinating on some very important things today, I taught myself how to make an attractive and viable Google Earth layer that highlights geology. I started doing it to accompany a map and related text in southern Nevada, and then remembered that I claimed that I would produce this type of thing (with help!) for the Owyhee project.


I did this with a lot of help from Google who have recently created a spreadsheet template (using Google Docs) that makes this a pretty painless process. I thought it would be hard until I watched a 5-minute tutorial.

I can't post a file on Blogger, so I will be sending each of you a kmz file for the Owyhee project and a slighly more realized one from the lower Colorado River. If you keep one or both of them in Google Earth (i.e. not in the Temporary Places folder) they will automatically update. If you are truly adventurous, I will share the spreadsheet with you so that you can add things (that means you, Liz...).

Thursday, February 21, 2008

Positive river trip prognosis...could have waited until May!?


Snowpack looking fine for upcoming river trip. Check out the handy website if it is new to you.

Thursday, February 14, 2008

UNLV Speaks About Argon-Argon

Here is a nice summary of the Ar-Ar analyses that surpasses anything that I was putting together. I will follow-up with Terry Spell with a discussion about the strat context of the samples.

Nevada Isotope Geochronology Laboratory - Sample Descriptions – House - NBMG

General Comments: Your samples were run as conventional furnace step heating analyses. This type of sample run produces what is referred to as an apparent age spectrum. The "apparent" derives from the fact that ages on an age spectrum plot are calculated assuming that the non-radiogenic argon (often referred to as trapped, or initial argon) is atmospheric in isotopic composition (40Ar/36Ar = 295.5). If there is excess argon in the sample (40Ar/36Ar > 295.5) then these ages will be older than the actual age of the sample. U-shaped age spectra are commonly associated with excess argon, and this is often verified by isochron analysis, which utilizes the analytical data generated during the step heating run, but makes no assumption regarding the composition of the non-radiogenic argon. Thus, isochrons can verify (or rule out) excess argon, and isochron ages are usually preferred if a statistically valid regression is obtained (as evidenced by an acceptably low MSWD value). If such a sample (U-shaped, or more generally discordant) yields no reliable isochron, the most conservative estimate of the age is that the minimum on the age spectrum is a maximum age for the sample (it could be affected by excess argon, the extent depending on the radiogenic yield). 40Ar/39Ar total gas ages are equivalent to K/Ar ages. Plateau ages are sometimes found, these are simply a segment of the age spectrum which consists of 3 or more steps, comprising >50% of the total gas released, which overlap in age at the ±2σ analytical uncertainty level. Such ages are preferred to total gas or maximum ages if obtained. However, in general an isochron age is the best estimate of the age of a sample, even if a plateau age is obtained.

OWY-36 Basalt Groundmass

The age spectrum for this sample is discordant, with both positive and negative ages which overlap 0 within uncertainties, to ages as high as ~660 ka. The total gas age is 194 ± 27 ka, and is equivalent to a conventional K-Ar age. No plateau age or isochron age was defined by these data. This sample had very low, often negative radiogenic argon (%40Ar*) concentrations (i.e. there was no measurable 40Ar* in two of the steps), likely reflecting both low-K contents and young age. In a case such as this there are two possible interpretations. The first is that the sample contains no excess argon and the total gas age is a reasonable estimate. Unfortunately, with no isochron the presence, or absence, of excess argon cannot be confirmed, making this interpretation somewhat tenuous. The most conservative approach is to assume that the discordance is a result of excess argon, and thus the minimum age on the age spectrum is a maximum age for the sample. In this case, since the minimum ages are actually negative, this interpretation would hold that the sample is effectively 0-age. It should be noted that in such as case as this discordance could simply result from there being very little, to no, measurable 40Ar*, which would result in inaccurate and imprecise age determinations. Which interpretation one should choose depends somewhat on geologic relationships. Does the geology and stratigraphy support an age as old as ~194 ka?

OWY-35 Basalt Groundmass

The age spectrum for this sample is mildly discordant and U-shaped. Ages range from an initial age of ~450 ka, to a plateau segment with ages of ~250 ka, and a higher final step age of ~780 ka. The total gas age is 301 ± 24 ka. Steps 2-10 (94% of the total 39Ar released) define a plateau with a younger age of 248 ± 25 ka. Steps 1-4 (49% of the total 39Ar released) yield an isochron age of 179 ± 21 Ma. The isochron indicates the presence of excess argon (initial 40Ar/36Ar = 305 ± 2) in this sample. Thus, ages calculated for the age spectrum, which assume the initial argon has 40Ar/36Ar = 295.5, should be considered anomalously old. The isochron age is the most reliable for this sample. Note that the radiogenic yields are significantly higher for this sample than for the previous OWY-36 sample, thus the ages should be considered significantly more reliable.

OWY-23 Basalt Groundmass

The age spectrum for this sample is also moderately discordant and U-shaped, with ages which fall from an initial step of ~1.5 Ma to a plateau segment with ages of ~180 ka, and followed by older steps (to ~840 ka) in the final ~15% gas released. The total gas age is 292 ± 39 ka. Steps 2-7 (81% of the total 39Ar released) define a plateau with a younger age of 182 ± 42 ka. Steps 2-7 also yield an imprecise isochron age of 120 ± 130 ka. The isochron does not indicate the presence of excess argon (initial 40Ar/36Ar = 298 ± 6) in this sample. Also, note that all the data points defining the isochron fall near the y-axis in a cluster (similar radiogenic yields, ), thus the y-axis intercept (initial 40Ar/36Ar ratio) is fairly well defined, whereas the x-axis intercept (age) is very poorly defined. Thus, this isochron is not useful for age determination, but does provide important information regarding excess argon, i.e. within uncertainty the sample cannot be said to contain excess argon. Other processes, such as recoil of reactor generated 39Ar during irradiation, can also produce discordant age spectra for fine grained basalt groundmass samples, and this may explain this samples age spectrum in particular. Given these considerations, the plateau age should be considered the most reliable for this sample.

OWY-22 Basalt Groundmass

The age spectrum for this sample is nearly ideally flat and concordant, with the exception of higher ages in the final ~10% gas released. The total gas age is 70 ± 19 ka, and steps 1-8 (88% of the total 39Ar released) define a plateau with a younger age of 38 ± 21 ka. Steps 2-5 define a valid isochron age, however, as for OWY-23 above, the data are tightly clustered at the y-axis due to similar, and low, %40Ar* values, making this isochron useful only for confirming the composition of the initial 40Ar/36Ar ratio, which is indistinguishable from atmospheric argon. Thus, the plateau age can be considered reliable and the best estimate of the eruption age for this sample.

OWY-13 Basalt Groundmass

The age spectrum for this sample is discordant, with ages that fall, rise, and fall again with increasing %39Ar released. The total gas age is 8.3 ± 0.6 Ma. Steps 3-7 (62% of the total 39Ar released) define a plateau with a younger age of 7.0 ± 1.0 Ma. There was no isochron defined by these data. The discordance shown by this samples age spectrum must be considered to be potentially caused by the presence of excess argon, although this cannot be confirmed or denied since no isochron was obtained. Thus, in this case the most conservative interpretation is that the youngest age on the age spectrum (step 10, 3.6 Ma) is a maximum age for the sample.

OWY-12 Basalt Groundmass

This sample is similar to OWY-36 described above, and similar interpretations apply. The total gas age is 453 ± 94 ka. Steps 3-5 (50% of the total 39Ar released) define a plateau with a younger, and imprecise, age of 173 ± 145 ka. There was no isochron defined for this sample. Note that overall the age spectrum is distinctly U-shaped. This may indicate excess argon is present in the sample and thus calculated ages may be anomalously old. This cannot be confirmed as no isochron was obtained. As for OWY-36, since several steps yield negative radiogenic yields and 0-age calculations this sample is best interpreted as being effectively 0-age, i.e. it is so young that we cannot accurately measure the accumulated 40Ar* against the background of initial argon. The plateau age should only be used if stratigraphic constraints suggest it is accurate.

As is typical, these comments are made with little knowledge of geologic relationships and are simply interpretations of the laboratory data. Often knowledge of, e.g., stratigraphic relationships can determine which interpretation is most valid for a particular sample. The first sample above, OWY-36 is a good example of this. Feel free to call or email (best way to contact me terry.spell@unlv.edu) if you have further questions that I might assist with.

Virtual Reality on the Owyhee? Almost.


Today, Valentine's Day, was a red-letter day for mapping on the Owyhee. NBMG recently obtained some very cool software and hardware for mapping in 3-D. With the help of digital photgrammetry and several other things I only vaguely understand, it is possible to build orthorectified and georectified stereo-models in the digital domain, map on them, and then export the lines (with z-values no less) into ArcGIS. Today, my colleague Nick put me through the preliminary ropes with some Owyhee images, and I am sold. Extremely cool, and not nearly as complicated as a PG-2 plotter to set up.


I plan on fine-tuning the Owyhee map with this device before the river trip. Note, if I have time, I can also extract a very accurate longitudinal profile for the river (or any feature for that matter). Stay tuned. I can even cut cross-sections if necessary...extremely freakin' cool.

Wednesday, February 6, 2008

Recent article of high relevance

Check out the recent issue of Geosphere for some new insights / interpretations of lava and river interactions in Grand Canyon (with an interesting lidar application):

From Geosphere, February 2008; v. 4; no. 1; p. 183-206
History of Quaternary volcanism and lava dams in western Grand Canyon based on lidar analysis, 40Ar/39Ar dating, and field studies: Implications for flow stratigraphy, timing of volcanic events, and lava dams

Ryan Crow, Karl E. Karlstrom, William McIntosh, Lisa Peters, and Nelia Dunbar


A synthesis of the geochronology on basalt flows from the southern Uinkaret volcanic field indicates that basalts erupted within and flowed into Grand Canyon during four major episodes: 725–475 ka, 400–275 ka, 225–150 ka, and 150–75 ka. To extend the usefulness of these dates for understanding volcanic stratigraphy and lava dams in western Grand Canyon, we analyzed light detection and ranging (lidar) data to establish the elevations of the tops and bottoms of basalt-flow remnants along the river corridor. When projected onto a longitudinal river profile, these data show the original extent of now-dissected intracanyon flows and aid in
correlation of flow remnants. Systematic variations in the elevation of flow bottoms across the Uinkaret fault block can be used to infer the geometry of a hanging-wall anticline that formed adjacent to the listric Toroweap fault.

The 725–475 ka volcanism was most voluminous in the area of the Toroweap fault and produced dike-cored cinder cones on both rims and within the canyon itself. Mapping suggests that a composite volcanic edifice was created by numerous flows and cinder-cone fragments that intermittently filled the canyon. Reliable 40Ar/39Ar dates were obtained from flows associated with this period of volcanism, including Lower Prospect, Upper Prospect, D-Dam, Black Ledge, and Toroweap. Large-volume eruptions helped to drive the far-traveled basalt flows (Black Ledge), which flowed down-canyon over 120 km. A second episode of volcanism, from 400 to 275 ka, was most voluminous along the Hurricane fault at river mile 187.5. This episode produced flow stacks that filled Whitmore Canyon and produced the 215-m-high Whitmore Dam, which may have also had a composite history. Basaltic river gravels on top of the Whitmore remnants have been interpreted as “outburst-flood deposit” but may alternatively represent periods when the river established itself atop the flows. Remnants near river level at miles 192 and 195, previously designated as Layered Diabase and Massive Diabase, have been shown by 40Ar/39Ar dating to be correlative with dated Whitmore flow remnants, and they help document the downriver stepped geometry of the Whitmore Dam. The ca. 200 and 100 ka flows (previously mapped as Gray Ledge) were smaller flows that entered the canyon from the north rim between river mile 181 and Whitmore Canyon (river mile 187.5); they are concordant with dates on the Whitmore Cascade as well as other cascades found along this reach.

The combined results suggest a new model for the spatial and temporal distribution of volcanism in Grand Canyon in which composite lava dams and edifices, that were generally leaky in proximal areas, were built from 725 to 475 ka near Toroweap fault and around 320 ka near Whitmore Canyon. New data on these and other episodes present a refined model for complex interactions of volcanism and fluvial processes in this classic locality. Available data suggest that the demise of these volcanic edifices may have involved either large outburst-flood events or normal fluvial deposition at times when the river was established on top of basalt flows.

Check out the interesting graphics the authors provide about lava dams:


Monday, February 4, 2008

Ar-Ar Geochron Table

Sample Location Total Gas Plateau
Isochron
OWY-12 Lower Saddle Butte 452.8 ± 94.1 173.0 ± 144.8
n/a
OWY-13 Upper Saddle Butte 8.31 ± 0.62 Ma 7.03 ± 1.00
n/a
OWY-22 Upper West Crater 69.86 ± 19.15 37.60 ± 21.01
7.0 ± 8.5
OWY-23 Lower West Crater (?) 292 ± 39 182 ± 42
120 ± 130
OWY-35 Upper AM-PM 301 ± 24.3 247.6 ± 24.9
179 ± 21
OWY-36 Lower AM-PM 194 ± 27 n/a
n/a

Here is a blurb of related text I received from UNLV:

Nevada Isotope Geochronology Laboratory - Sample Descriptions

General Comments:

Isochrons are the most desirable treatment of 40Ar/39Ar data. This is because the isochron actually defines the isotopic composition of the initial argon in the sample (non-radiogenic argon). Ages calculated for an age spectrum are referred to as "apparent ages" because they are calculated assuming the initial argon is atmospheric in composition - thus, if there is excess argon (40Ar/36Ar > 295.5) the age will be overestimated. Isochrons have their measure of reliability, known as the mean square of weighted deviates (MSWD) which is a statistical goodness of fit parameter. If it is greater than a certain value (which changes depending on the number of points, see Wendt and Carl, 1991, the statistical distribution of the mean squared weighted deviation, Chem. Geol., v. 86, p. 275-285) then there is more scatter than can be explained by analytical errors and it is not a statistically valid isochron. If we provide an isochron it means that the statistical test is valid, if not then no valid isochron was obtained. Also, there are issues of number of data points defining the isochron - the more the better. Four points should be considered a bare minimum for statistical reasons, three points is getting to be a real concern. This can be understood simply by considering two points - a perfectly fit straight line can be put through any two points, so completely accidental data can have a perfect line fit. It follows that with three points there is less of a chance of an accidental line fit, but it is still a very real possibility (especially if analytical errors are fairly large), this possibility gets exponentially smaller as the number of points defining the line (isochron) goes up, thus more points = a more reliable isochron.

If there is no isochron, then a plateau age is next in preference. This is because a sample that gives ages which are analytically indistinguishable from step to step is exhibiting what is known as "ideal" behavior, which suggests it has a simple geologic history, e.g., rapid cooling as a basalt lava, followed by no reheating or alteration, both of which may produce disturbed (discordant) age spectra. A reliable plateau is 3 or more consecutive steps which are indistinguishable in age at the 2 sigma level and comprise >50% of the total 39Ar released. The lack of an isochron or a plateau does not mean the sample provides no useful information, but their presence gives greater confidence in the ages obtained and requires less subjective interpretation.

Of course, you must consider that we run samples such as this "blind" in that we do not know the geologic relations of the samples, either when we analyze them, or when we provide these general interpretations. The geologic constraints must always be considered when interpreting isotopic ages; if any discrepancies arise feel free to discuss them with us, as it can in some cases make a difference in how age data are interpreted. All analytical errors are 1σ.


Map of Owyhee Geochronology Samples

Below is a map showing the locations of geochron samples from or related to our project. OSL samples in yellow; Ar-Ar (with results!) in green; Cosmo (with results) in blue; and Champion's p-mag sample sites in red. Rest assured that I will follow-up with some more info about the weakly satisfying Ar-Ar data and tell you what I have learned about it. In the meantime, enjoy the map.


View Larger Map

Wednesday, January 9, 2008

Landslide Dam References of Interest

Last night, I quickly compiled this reference list. Thought it may spark some interest. Using Zotero and Google Scholar, I put it together in about 15 minutes!

Adams, J. (1981). Earthquake-dammed lakes in New Zealand. Geology, 9(5), 215-219.

Alford, D., Schuster, R. L., & Reduction, I. S. F. D. (2000). Usoi Landslide Dam and Lake Sarez: An Assessment of Hazard and Risk in the Pamir Mountains, Tajikistan. United Nations.

Antognigni, M., & Volpers, R. (2002). A late Pleistocene age for the Chironico rockslide (Central Alps, Ticono, Switzerland). Bull Appl Geol, 7, 113-125.

Bovis, M. J., & Jakob, M. (2000). The July 29, 1998, debris flow and landslide dam at Capricorn Creek, Mount Meager Volcanic Complex, southern Coast Mountains, British Columbia. Canadian Journal of Earth Sciences, 37, 1321-1334.

Canuti, P., Frassoni, A., & Natale, L. (1994). Failure of the Rio Paute Landslide Dam. Landslide News International Newsletter, ISSN, 0919-5629.

Ermini, L., & Casagli, N. (2003). Prediction of the behaviour of landslide dams using a geomorphological dimensionless index. Earth Surface Processes and Landforms, 28(1), 31-47.

Gardner, J. N., Lavine, A., WoldeGabriel, G., Krier, D., Vaniman, D., Caporuscio, F., et al. (1999). Structural Geology of the Northwestern Portion of Los Alamos National Laboratory, Rio Grande Rift, New Mexico: Implications for Seismic Surface Rupture Potential from TA-3 to TA-55. LA-13589-MS, Los Alamos National Lab., NM (US).

Goff, F., Reneau, S., Rogers, M. A., Gardner, J. N., Smith, G., Broxton, D., et al. (1996). Third-day road log, from Los Alamos through the southeastern Jemez Mountains to Cochiti Pueblo and the Rio Grande. The Jemez Mountains Region. New Mexico Geological Society Field Conference Guidebook, 47, 59-97.

Hancox, G. T., & Limited, I. O. G. &. N. S. (1999). Mt Adams Rock Avalanche of 6 October 1999 and the Subsequent Formation and Breaching of a Large Landslide Dam in Poerua River, Westland, New Zealand. Institute of Geological & Nuclear Sciences.

Hancox, G. T., McSaveney, M. J., Manville, V. R., & Davies, T. R. (2005). The October 1999 Mt Adams rock avalanche and subsequent landslide dam-break flood and effects in Poerua River, Westland, New Zealand. New Zealand Journal of Geology and Geophysics, 48(4), 683–706.

Hermanns, R. L., Niedermann, S., Ivy-Ochs, S., & Kubik, P. W. (2004). Rock avalanching into a landslide-dammed lake causing multiple dam failure in Las Conchas valley (NW Argentina)—evidence from surface exposure dating and stratigraphic analyses. Landslides, 1(2), 113-122.

Hermanns, R. L., & Strecker, M. R. (1999). Structural and lithological controls on large Quaternary rock avalanches (sturzstroms) in arid northwestern Argentina. Bulletin of the Geological Society of America, 111(6), 934-948.

Huscroft, C. A., Ward, B. C., Barendregt, R. W., Jackson, L. E., & Opdyke, N. D. (2004). Pleistocene volcanic damming of Yukon River and the maximum age of the Reid Glaciation, west-central Yukon. Canadian Journal of Earth Sciences, 41(2), 151-164.

King, J., Loveday, I., & Schuster, R. L. (1989). The 1985 Bairaman landslide dam and resulting debris flow, Papua New Guinea. Quarterly Journal of Engineering Geology and Hydrogeology, 22(4), 257.

Korup, O. (2006). Rock-slope failure and the river long profile. Geology, 34(1), 45-48.

Malamud, B. D., Jordan, T. E., Alonso, R. A., Gallardo, E. F., González, R. E., & Kelley, S. A. (1996). Pleistocene Lake Lerma, Salta province, NW Argentina. Congreso Geológico Argentino, 58(1).

Meyer, W., Schuster, R. L., & Sabol, M. A. (1994). Potential for Seepage Erosion of Landslide Dam. Journal of Geotechnical Engineering, 120(7), 1211-1229.

Read, S. A. L., Beetham, R. D., & Riley, P. B. (1991). Lake Waikaremoana barrier-A large landslide dam in New Zealand. Landslide News, 54(1), 1.

Recent research on landslide dams - a literature review with special attention to New Zealand. (2002). Retrieved January 9, 2008, from http://ppg.sagepub.com/cgi/content/abstract/26/2/206

Reneau, S. L. (2000). Stream incision and terrace development in Frijoles Canyon, Bandelier National Monument, New Mexico, and the influence of lithology and climate. Geomorphology, 32(1-2), 171-193.

Reneau, S. L., & Dethier, D. P. (1996a). Pliocene and Quaternary history of the Rio Grande, White Rock Canyon and vicinity, New Mexico: New Mexico Geological Society Guidebook. 47 thField Conference, Jemez Mountains Region, 317-324.

Reneau, S. L., & Dethier, D. P. (1996b). Pliocene and Quaternary history of the Rio Grande, White Rock Canyon and vicinity, New Mexico. Jemez Mountain region: New Mexico Geological Society Guidebook, 47, 317–324.

Reneau, S. L., & Dethier, D. P. (1996). Late Pleistocene landslide-dammed lakes along the Rio Grande, White Rock Canyon, New Mexico. Geol Soc Am Bull, 108(11), 1492-1507.

Sowma-Bawcom, J. A. (1996). Breached landslide dam on the Navarro River. California Geology, 49(5), 120-128.

Trauth, M. H., Alonso, R. A., Haselton, K. R., Hermanns, R. L., & Strecker, M. R. (2000). Climate change and mass movements in the NW Argentine Andes. Earth and Planetary Science Letters, 179(2), 243-256.

Trauth, M. H., & Strecker, M. R. (1999). Formation of landslide-dammed lakes during a wet period between 40,000 and 25,000 yr BP in northwestern Argentina. Palaeogeography, Palaeoclimatology, Palaeoecology, 153(1), 277-287.

Wayne, W. J. (1999). The Alemania rockfall dam: A record of a mid-holocene earthquake and catastrophic flood in northwestern Argentina. Geomorphology, 27(3-4), 295-306.